
Photo: Deutsches Museum
In Focus
Special Objects in the Environment Exhibition
Take a look at the special objects in the Environment exhibition.
Atmosphere Globe
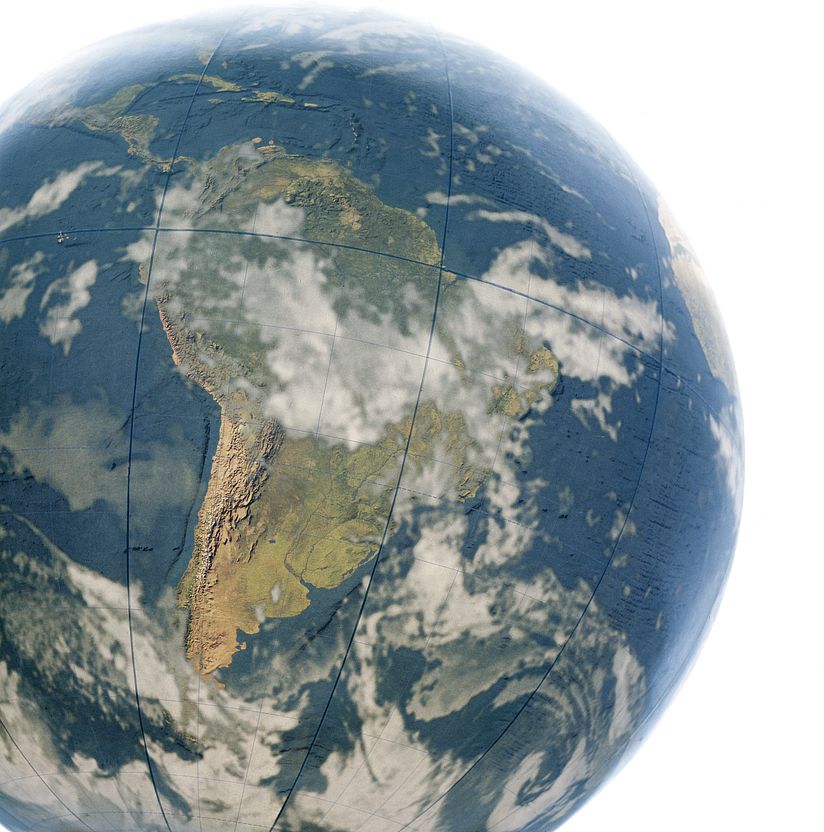
Atmosphere globe. Photo: Deutsches Museum
A new Look at the Climate: complex Interactions within the Earth System
Research shows the current climate to be an expression of a complex process that involves all the “spheres” of the Earth system.
In addition to the atmosphere and the oceans (hydrosphere), this system consists of the land surface (lithosphere), the Earth’s ice and snow masses (cryosphere), as well as living organisms (biosphere) and sunlight.
Changes in the climate – unlike changes in the weather – are not caused by the atmosphere alone, but by the interactions between the atmosphere and other parts of the climate system, such as the oceans.
The parts of the climate system influence one another by exchanging substances, momentum and energy. They respond to external influences – but at different speeds: some changes in the climate, such as the El Niño phenomenon, occur within a few years. Others, such as the change from an ice age to a warm period, take millions of years.
The atmosphere is a thin layer of gas that protects our Blue Planet and keeps it warm. It consists of the mix of gases in the air, clouds and precipitation, as well as airborne particles known as aerosols. The weather and the climate take place in the atmosphere. It is the part of the climate system that changes most quickly, and the chemical and radiation processes that take place within it, along with its dynamics, affect the climate. Water and oxygen, for example, are distributed and made available in global material cycles. The winds transport solar energy from the equator to the poles. Water vapour, carbon dioxide and other trace gases absorb and reflect sunlight, holding back and trapping the thermal radiation that emanates from the Earth. Without this natural greenhouse effect, the average temperature on the Earth would be -18°C. Human activity interferes with the climate system by changing the concentration of the trace gases.
The globe, which comprises several satellite images, shows the typical distribution of clouds in the atmosphere: cloudy over the equator and in the high northern and southern latitudes, and cloud-free over the Earth’s desert belt. The eddies over Europe and to the south of Africa and South America illustrate the circulation systems of the atmosphere, the fastest changing component of the climate system.
Growth Curve
The population growth curve. Photo: Deutsches Museum
The Growth in Global Population
From the beginning of human history to the present day, around 77 billion people have lived on the Earth.
Our model shows how the global population has developed over the last 7,000 years.
Starting with around 10 million people in the year 5000 BC, the population initially increased very slowly. Around the time of the birth of Christ, the world’s population was about 150 million. The population losses in the mid-14th century as a result of the Black Death are clearly visible. Around 30 million Europeans died – one third of Europe’s population at the time. The decline in the population as a result of the Thirty Years’ War in the mid-16th century is also noticeable.
On the other hand, the large population losses of World War II (1939–1945) – around 50 million people – does not have a visible impact on the curve.
... and what now?
Every two years, the United Nations predicts the development of the world’s population – based on regularly collected data on the numbers of births and deaths, life expectancy and the age distribution of the population.
In May 2020, the global population was around 7.8 billion people (and therefore around 2.8 billion more than in 1987). The UN expected a population increase of around 78 million people each year for the period between 2015 and 2020, and anticipates a global population of around 9.7 billion people in 2050; 10.9 billion is predicted for the year 2100.
On average, women around the world are now having fewer children than in the past: in the 1960s, one woman give birth to around five children on average; in 2020, it is just 2.4. This means that population growth is slowing down, which is also reflected in the UN’s lower projections for population figures: until recently, they had predicted a population of 11.2 billion in 2100; in 2020 this number was revised to “only” 10.9 billion people.
Column of Waste
The column of waste in the exhibition. Photo: Deutsches Museum
Our Waste
In 2018, German waste generation amounted to approximately 420 million tonnes. If we were to load this waste onto a goods train, it would be 105,000km long and stretch two and a half times around the world.
In the same year, each German citizen threw away an average of around 457kg (or 5.5m³) of domestic waste.
In 1960, it was just 83kg (or 1m³) – less than a fifth of the current amount.
Domestic waste consists primarily of organic waste, paper and packaging.
The sharp rise in this annual mountain of waste is caused primarily by an increase in all kinds of disposable products. With the help of the German Packaging Ordinance, the “Green Dot” system (der Grüne Punkt) and the German Recycling and Waste Management Act, attempts are being made to curb waste generation: an analysis by the German Environment Agency in 2018 shows that in Germany, around half as much residual waste was being generated than 33 years previously (128kg in 2018, 239kg in 1985). Waste paper, used glass, metals and plastics in particular are now being separated and collected as recyclable materials. However, one third of all organic waste is still being thrown away in the same bin as general domestic rubbish.
Our object “Column of Waste” illustrates the quantity of paper, metal, plastic and glass waste generated by a two-person household over three months. The organic waste has been replaced by earth and plastic mock-ups and would make up a much greater proportion of the column.
Kitchens
Model of a kitchen from the period around 1900. Photo: Deutsches Museum
Model of a kitchen from the period around 1990. Photo: Deutsches Museum
Energy Consumption – a Measure of Prosperity
Energy is an essential part of our lives. We consume it directly for heating, for locomotion and to power machines, and indirectly in the form of food, consumer goods and packaging. From 1860 to 1990, the global population increased fivefold, whilst energy consumption increased sixtyfold. The reasons for this include increased prosperity for a part of the world’s population combined with the availability of machines that make life easier – both in industrial and agricultural production as well as in the home.
The two models represent kitchens from around 1900 and around 1990 with the furniture and appliances that were typical for each period. You can see that in 1900, most of the work in the home had to be done by hand. This is in contrast to today, where electrical appliances have taken over these tasks.
Electrical appliances help to save time and effort in the home. In 1990, more than 85 out of every 100 households have a vacuum cleaner, a washing machine and an electric oven. 75% of households have a fridge – just as many have a chest freezer, 53% a dishwasher, 33% a tumble dryer and 27% a microwave.
Environmental Analysis: Bianchi Thermometer and Gas Detection Tubes

Bianchy thermometer. Photo: Deutsches Museum | Christian Illing
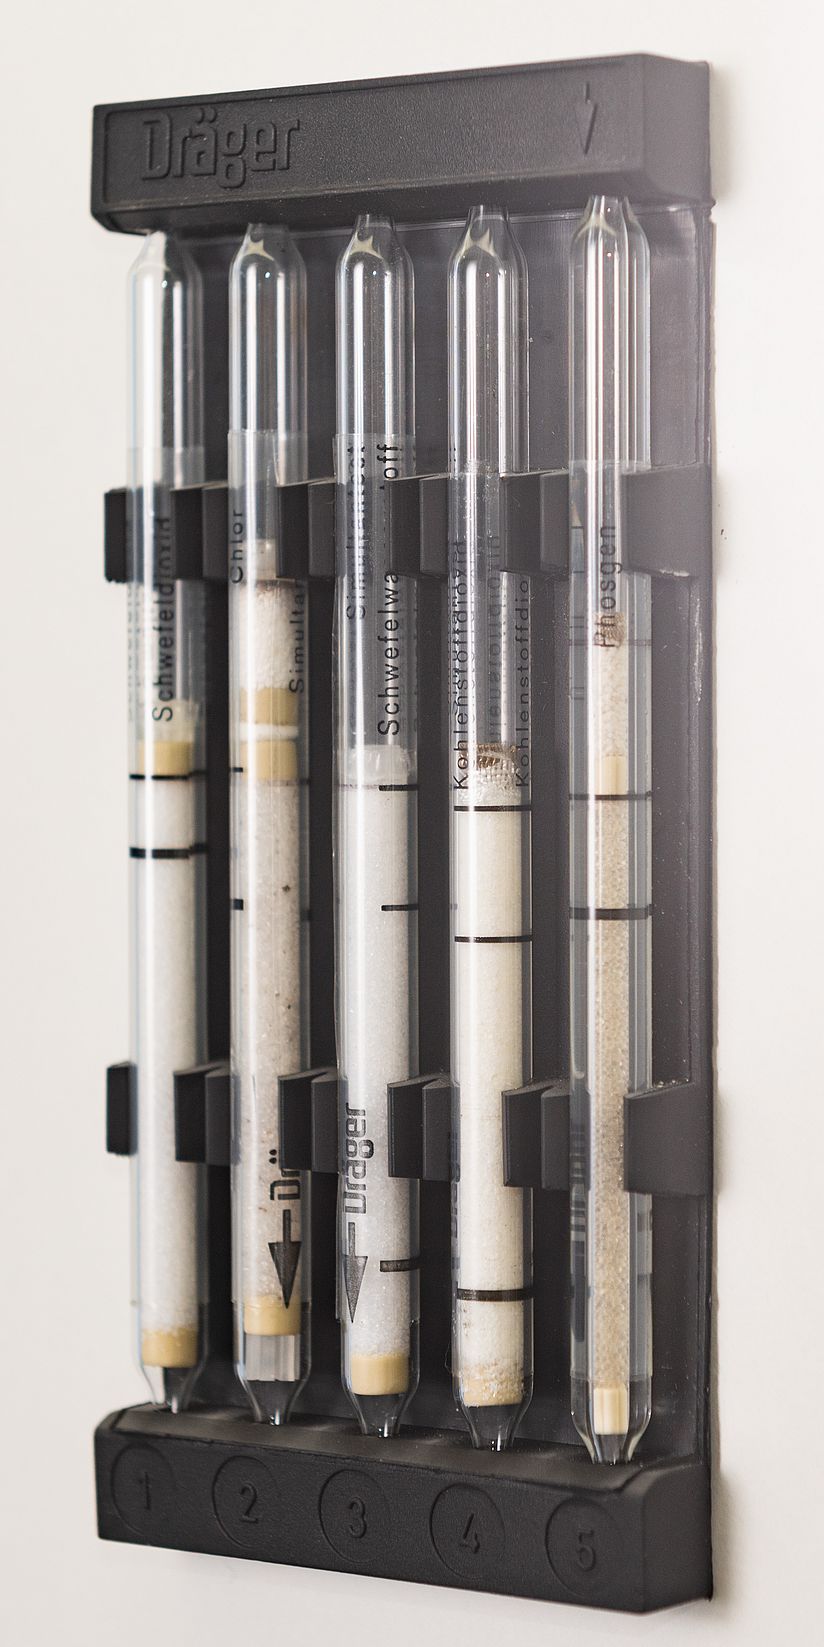
Gas detection tubes. Photo: Deutsches Museum | Christian Illing
Environmental Analysis now and in the Past
In the Age of Enlightenment, people discovered nature as a field of scientific research. Experiments and innovative apparatus extended the previous limits of sensory perception: for example, from the 17th century, the telescope and the microscope made things visible that had previously been invisible.
The thermometer and the barometer made it possible to measure temperature and air pressure objectively. With these instruments, people attempted to understand their environment and deduce laws from what they found. They paved the way for modern environmental analysis, which makes it possible to detect minute quantities of a substance.
The thermometer from 1767 was produced by Jakob von Bianchy, an instrument maker and a teacher of experimental physics.
Today, environmental analysis deals with the identification of chemical substances in the air, water and soil. In order to be able to make statements about the harmful effects of a substance, it is first necessary to determine the total content of the substance in a sample. The chemical form must also be identified, as this defines the mobility, the bioavailability and the (potentially toxic) effects: for example, chlorine as a chloride in cooking salt (NaCl) is not toxic, unlike elemental chlorine (Cl2). Information about the substance’s behaviour in the environment, its distribution, concentration and transformation – as well as its possible interactions with soil, water, air and organisms – is also required.
The assessment of the harmful substance is based on the statutory limit values, which determine whether measures have to be taken to protect the environment, and if so, which ones. Important substances that are studied include heavy metals, pesticides, greenhouse gases and particulate matter. Impact and substance parameters such as the biological and chemical oxygen demand are also calculated and can be used to judge the degree of contamination of waste water, for example.
Gas detection tubes are used to identify harmful substances in the air. They are one of the traditional measuring methods for gas analysis. The reagent system is in the closed glass body. It reacts with the ambient air, changing colour as soon as the tube is opened and the reagent comes into contact with the relevant gas. To analyse the gas, you can read the strength of the colour change using the scale on the tube.
Wastewater Treatment Plant
Model of the Gut Marienhof wastewater treatment plant on a scale of 1:500. Photo: Deutsches Museum
What is Waste Water and how is it cleaned?
We get our drinking water from the tap. It becomes waste water once it is used in the home – for example when washing the dishes, doing the laundry, having a bath or going to the toilet. This waste water is contaminated mainly with organic substances such as food residues, detergent, soap, hair, faeces or toilet paper. Newspaper, sand, leaves, pieces of wood and gritting salt end up in the waste water from the water drained from the road when it rains. Then there is waste water from commercial enterprises, which is also largely purified in wastewater treatment plants.
In the past, waste water was simply discharged into rivers. There, the organic contaminants introduced by human activities were broken down – that is to say eaten – by microorganisms. A few kilometres down the river, the water was once again clean as a result.
Nowadays, the amount of waste water is so high – especially in large cities and conurbations – that the self-cleaning properties of rivers are no longer sufficient. Therefore, the waste water is purified in wastewater treatment plants before being discharged into the rivers. The biological processes in a wastewater treatment plant are essentially the same as the self-cleaning processes in natural bodies of water; they are simply concentrated in one place and are much faster.
Our model of the Gut Marienhof wastewater treatment plant north of Munich was produced by the company Matthes Modellbau on behalf of Munich’s municipal wastewater drainage service (Stadtentwässerung München) on a scale of 1:500, as requested by the Deutsches Museum. The model was constructed on the initiative of the city.
The Wastewater Treatment Plant – technical Data:
- Capacity: 1 million population equivalent
- Feed flow: 3,300l/s in dry weather; 5,000l/s in wet weather
- Waste water dwell time in dry weather: around 19 hours
Statues of Eve
Sandstone statue and plaster model: the left-hand statue is made of sandstone and is a late Gothic representation of Eve. It was part of the façade of the north tower of Regensburg Cathedral in the early 16th century. The plaster model to the right shows how the statue looked originally, before it was corroded. Photo: Deutsches Museum
Acid Rain: an environmental Problem of the Past?
The natural carbon dioxide content in the air already makes rain slightly acidic. Sulphur dioxide and nitrogen oxide emissions react with oxygen and water in the atmosphere to form sulphurous acid, sulphuric acid and nitric acid. These make the rain even more acidic.
Acid rain and sulphur dioxide not only acidify bodies of water, but they also corrode rocks and slowly dissolve them. As a result, buildings, monuments and façades gradually lose their contours. So in this case, environmental pollution also means the destruction of cultural heritage.
The statue to the rear is a late-Gothic representation of Eve, the first woman and the mother of mankind. It was a part of the façade of the north tower of Regensburg Cathedral from the early 16th century. For almost 100 years, the acidic air corroded the surface of the sandstone. The plaster model at the front shows how the statue looked originally, before it was corroded.
“GENVEX” Heat Recovery Unit

GENVEX heat recovery unit. Photo: Deutsches Museum | Christian Illing
Saving Energy in the Home
Unlike nitrogen oxide, for example, CO2 that is created by burning coal, wood, crude oil and any other organic fuel cannot be removed from the flue gas with a filter. That’s why we have to save energy – not only in industry, but in our homes and on transportation, too.
There are two ways we can save energy and reduce our impact on our environment. Either we use less energy – for example by cycling to work or heating our homes less. Or we use more efficient technology that reduces our energy requirements.
Heat recovery units save energy by extracting the heat from the used air in a room and using it to heat up the incoming air. Almost 100% of the heat energy from the used air is retained for use. However, the use of these units requires automatic ventilation in all the rooms that are to be heated. At the core of the unit on display is the large aluminium heat exchanger, where the paths of the incoming air and the used air cross. This is supplemented by a heat pump, which turns on when the fresh air temperature drops below 8°C.
![[Translate to English:] Das System Erde dargestellt durch verschiedene Globen.](/assets/_processed_/a/8/csm_Ausstellung_Umwelt_CD_L_7596_354_a668711f33.jpg)